This year while reading online about improving data graphics I kept coming across the name Edward Tufte. He is a professor interested in the topic and from what I gather has written 3 of the most influential books on the topic. Since I make a lot of plots and data graphics at work as a way to help understand system interactions and describe problems or system performance to others, I decided to buy two of the most well regarded:
- The Visual Display of Quantitative Information
- Envisioning Information
Reading these led to me spending a few evenings (over 3 weeks!) making a modern version of one of my favorite graphics seen in the books.
I read The Visual Display of Quantative Information in detail and mostly perused Envisioning Information. The later being less applicable to the graphics I frequently produce. They are both full of a wide variety of plots and other graphics. Almost every page has graphics and detailed, specific discussion of the good and bad characteristics in them.
Some of my favorites are of the non-numeric variety. This one shows the improvement in clarity achieved by reducing grids, and adding emphasis with color. The changes are subtle but their effectiveness is dramatically different.

These are of the biological variety and show motion in (what I find to be) really interesting ways. The advance of the gecko, the stride of a human and figures dancing (even choreographed to music!).


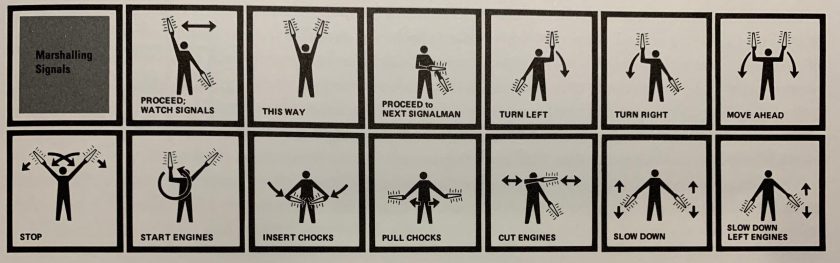
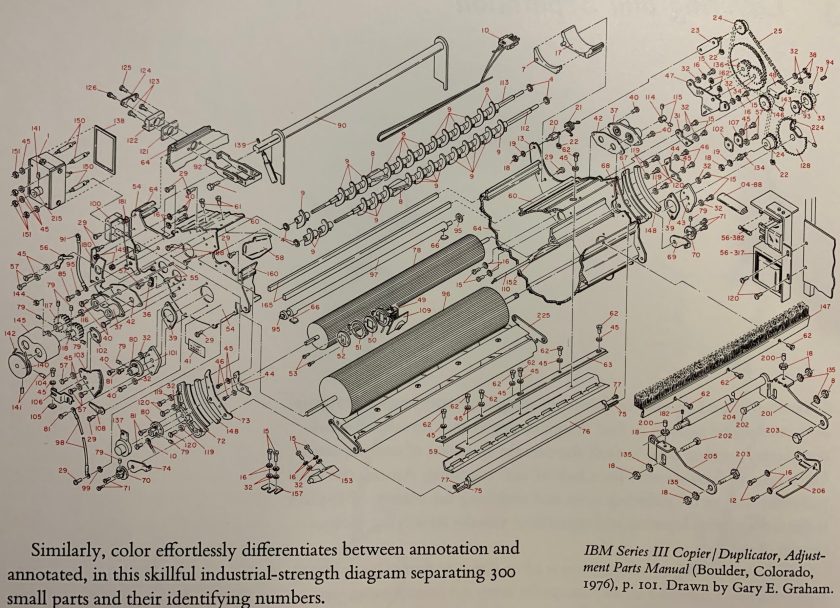
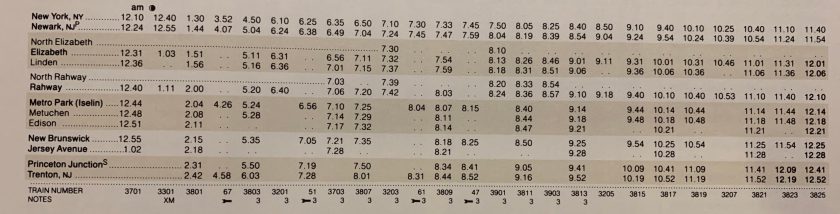
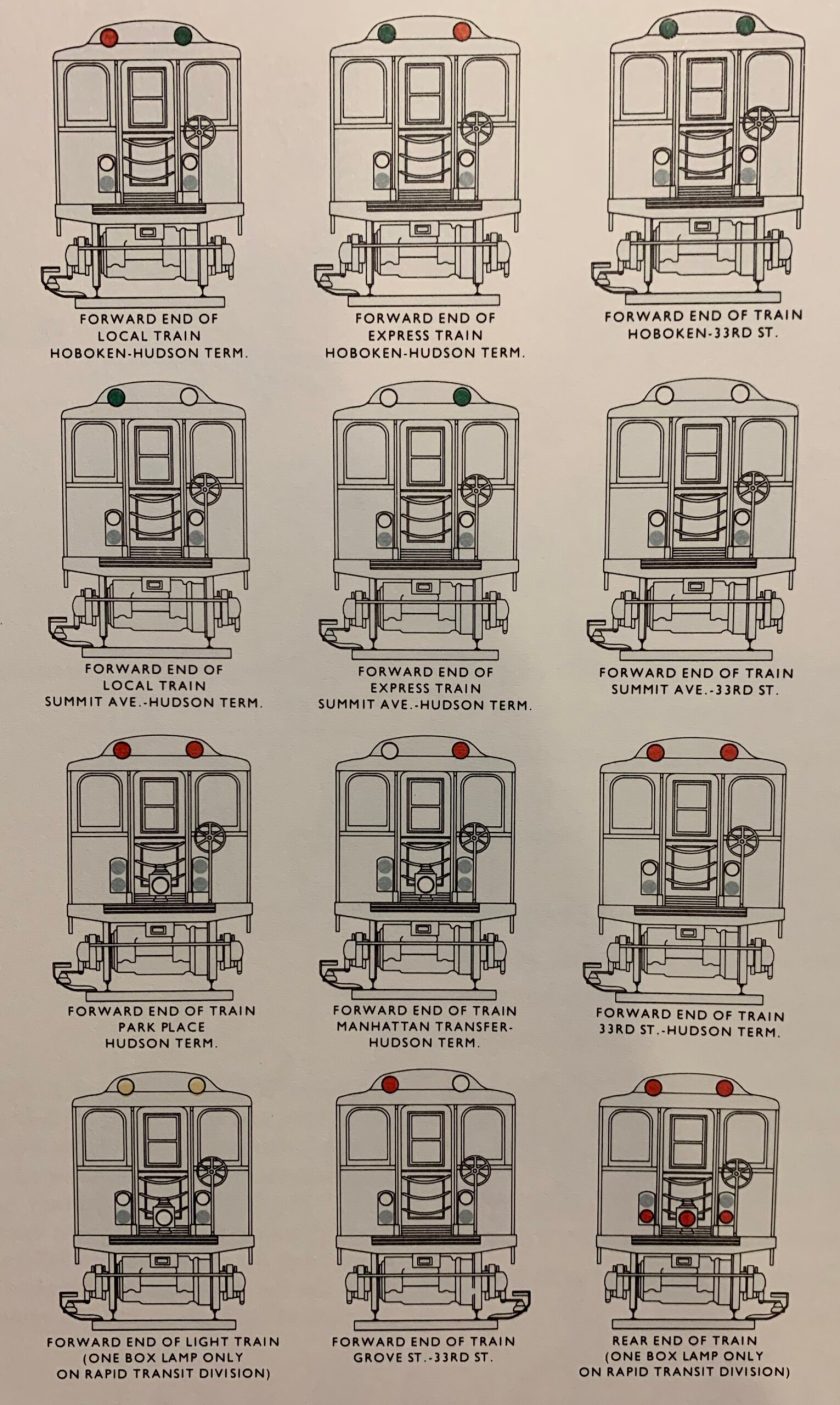
These graphics are getting closer to my domain. Diagrams which exemplify how to distinguish between part information, and chart meta data, examples of how styling decisions can lead to misleading or outright false impressions, and a cool state diagram for signal lights which I like but probably isn’t a great method considering the huge amount of ink devoted to showing state independent views (ie the train).

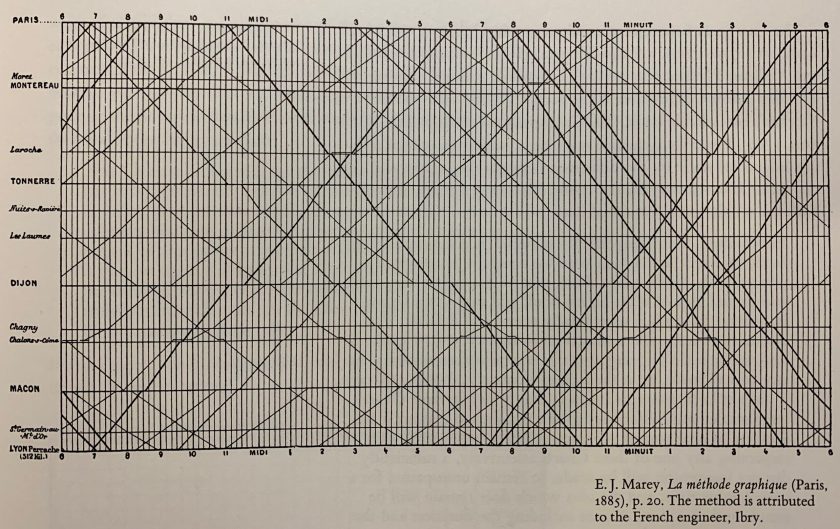
One graphic in particular held my attention, possibly since Tufte repeatedly uses is as a reference to describe some good or bad characteristics of data graphics. It is a train schedule from long ago showing the routes and time tables for travel between Paris and Lyon.
I decided to make my own version of it, using modern methods. To gather the data I used two sources. Caltrain’s site has the schedule. I copied Northbound and Southbound time tables and generated two csv files for reading with python. I also added milepost and station information based on the List of Caltrain Stations on Wikipedia. I started with matplotlib which is a standard tool I use at work, but quickly switched to bokeh which is another python plotting module which is billed as a great tool for use on the web.
Here is the matplotlib version which I didn’t spend much time on.


And here is the bokeh version. The output from the python script is an .html file which I’ve included here as an image below. The station names are spaced to scale based on the track distance in miles between them. Baby bullet routes are in bold. The plot begins zoomed in x from 6:00am to 10:00am, and in y from San Francisco to San Jose Diridon. However, a full 24 hours is available, as are all stations from San Francisco to Gilroy. Note San Francisco is actually at milepost 0.2. The 3rd and Townsend Southern Pacific Depot station which was previously the northern terminus was closed and would be at milepost 0.0 were it included. The data shown is for a normal weekday, and therefore does not show holidays, special Stanford football game service, weekend service to Atherton or Broadway stations, or special College Park station service. A few improvement ideas for the future:
- Typical stop duration is not reflected as this isn’t readily available on Caltrain’s site, but this could be gathered from an analysis of Caltrain realtime train location information
- Add station images as expanded hover tool tooltips
- Adjust line width to reflect speed between segments
The actual html version opens by clicking below and is fully interactive. And the python code is available here. The resulting caltrain_schedule html file can be opened in any browser.
Updated San Francisco to Gilroy:

Original Paris to Lyon: